Data and Findings
For our study on empathy in interactive storytelling, we collected and analyzed the following data:
- IRI data
- Biometric data
- Debriefing data
IRI Results
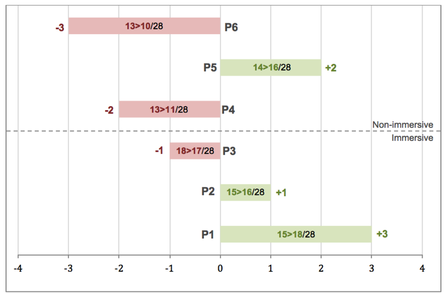
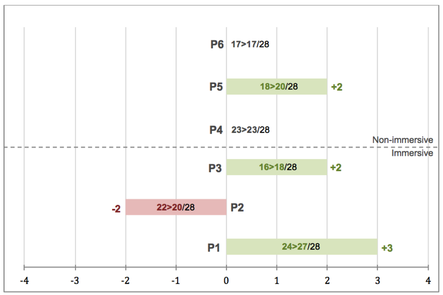
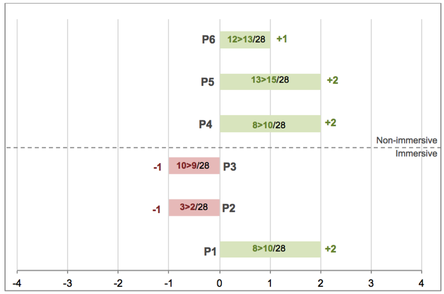
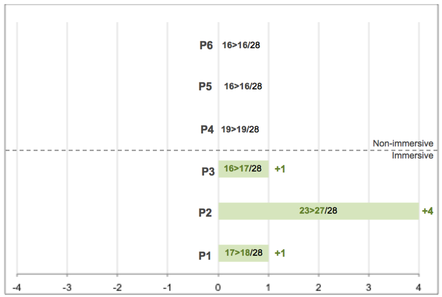
We compiled IRI data from all six participants into a spreadsheet along with some demographic and debriefing data. We used data from the spreadsheet to create the following charts, which show changes in empathy between pre- and post-evaluations. Green indicates an increase in empathy; whereas red indicates a decrease in empathy. Data for immersive participants is shown in the bottom half of the chart below the dotted line. To support our hypothesis that immersive participants would see a greater rise in empathy than non-immersive participants, we would expect to see more green in the lower half of the chart than in the top half of the chart. And we do see this for all IRI scales except the Personal Distress (PD) scale.
The PD scale measures the kinds of feelings, such as anxiety, that get in the way of helping others. Those who score high on the PD scale empathize with people in distress to the extent that they have difficulty being helpful in emergency situations. We postulate that the narrative in the immersive exhibit may have led to the low PD scores. The narrator coaches the visitor to "sit tight" and not let the counter protesters frighten the visitor from their seat at lunch counter.
Findings: In conclusion, we do see a rise in empathy for immersive participants when compared to non-immersive participants (except for the PD scale). However, we believe that more study with a greater number of participants is needed to confirm our original hypothesis.
|
Fantasy
|
Empathetic Concern
|
Personal Distress |
Perspective Taking |
|
|
Biometric Results
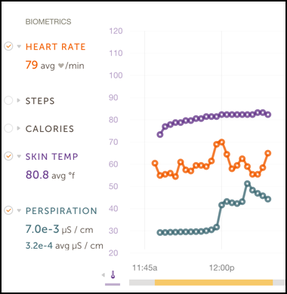
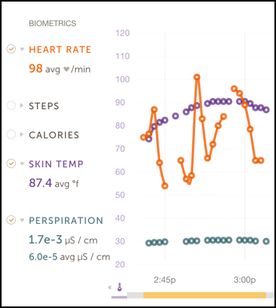
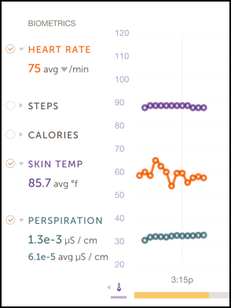
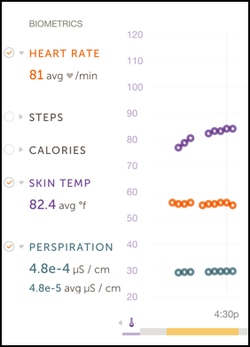
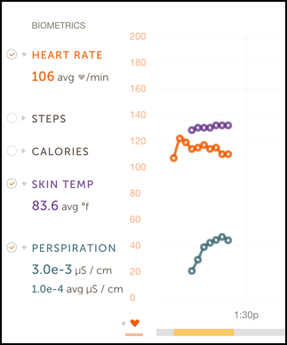
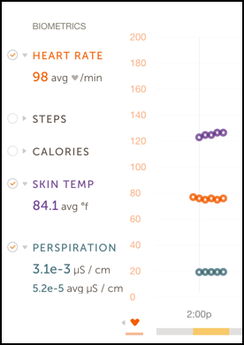
Biometric Charts: The charts below represent data gathered for each biometric parameter (Heart Rate, Skin Temperature, Galvanic Response, represented as "GSR") that we wanted to use to measure empathetic responses to the immersive or non-immersive stimuli experienced by each participant in our study.
Individual Charts
Participants 1, 2, and 3 represent the immersive group and participants 4, 5, and 6 represent the non-immersive group. Notes of interest in reviewing the data:
- Participant 1 had the highest average of the empathy scores among both the immersive group and non-immersive groups.
- Participants 2 (I) and 5 (N) are African-American. They exhibit the most significant heart rate responses for their given groups.
- Participant 3 (I) and 6 (N) have the lowest averages among the empathy scores with participant 3 (I) ranking 5 of 6, and participant 6 (N) ranking 6 of 6.
|
Participant 1 (I)
|
Participant 2 (I)
|
Participant 3 (I)
|
|
|
|
|
Participant 4 (N) |
Participant 5 (N) |
Participant 6 (N) |
|
|
|
Combined Charts
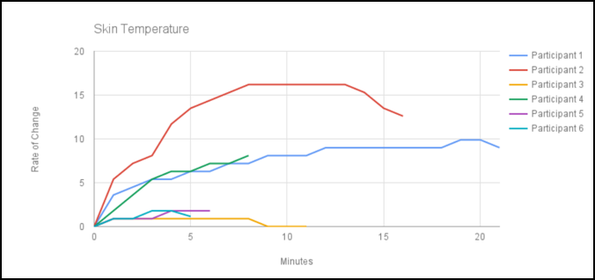
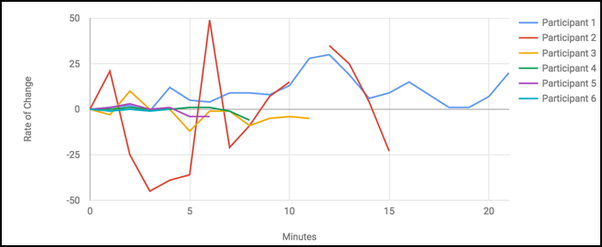
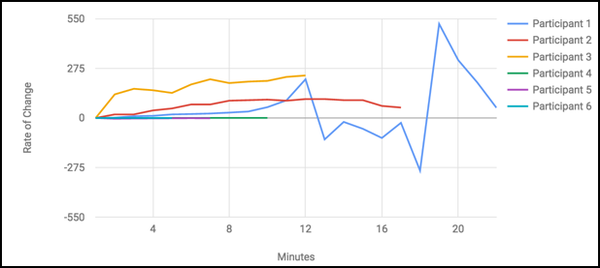
The bold colors for the line charts consistently represent the same participant. Blue is Participant 1, red is Participant 2, etc.
Skin Temperature
|
All participants experienced some change in skin temperature during the evaluation. No participants dropped below their baseline. Participants 1, 2, and 4 experience the highest change in skin temperature. Notably, these 3 rank highest in overall empathy scores. |
Heart Rate (BPM)
|
All 3 participants from the immersive group exhibit the most dynamic responses in heart rate during the evaluation. The non-immersive group shows the least amount of heart rate differentiation. |
Galvanic Response (GSR)
|
All 3 participants from the immersive group exhibit the most dynamic changes in GSR during the evaluation. The non-immersive group exhibit almost no change. |
Findings: In conclusion, we see that the immersive group produces the significantly more dynamic biofeedback responses than the non-immersive group. As stated earlier, we believe that more study with a greater number of participants is needed to confirm our original hypothesis.
Debriefing Results
|
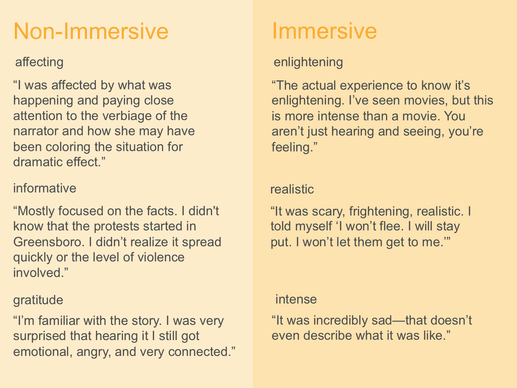
The illustration (RIGHT) summarizes representative comments from both groups as well as the one word each participant chose to describe their experience. To see all comments for each group, click the group that interests you:
Findings: Qualitative data from the debriefing sessions and our observations during those sessions showed that participants who experienced the immersive exhibit were more emotionally impacted by their experience than participants who listened to the non-immersive audio narrative. In fact, one participant left the immersive exhibit in tears. |
|